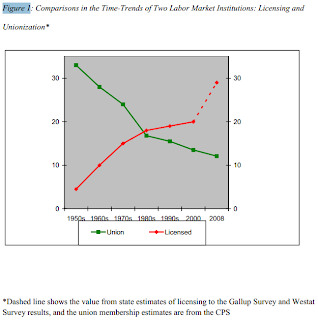
The chart below comes from an economic study on the impact of licensing requirements on the economy. This graph shows data from 1950 to 2008 illustrating how over the last 50+ years the amount of occupational licensing has increased while the amount of unionized workers has decreased! Read the whole paper at http://ftp.iza.org/dp5505.pdf


No comments:
Post a Comment